Quick start
This tutorial assumes you know how to programm in python and have a basic understanding of the pandas library.
To use @voc@ you need to follow these steps:
Install @voc@
You can install @voc@ using pip: (Run this directly in a notebook cell or in your terminal)
pip install avoca
Load the data
Internally @voc@ uses pandas dataframe.
The format must follow the specifed rules:
Columns are Multiindex containing in the first row, the name of the compound and in the second row the name of the variable.
If a variable is shared among all compounds, the compound is
-.One variable is reserved for each compound is called
flag. It will be used for assigning flagged values.
import pandas as pd
import numpy as np

np.random.seed(31415)

df = pd.DataFrame(
    np.random.randn(100, 4),
    columns=pd.MultiIndex.from_tuples(
        [
            ("compA", "area"),
            ("compA", "C"),
            ("compB", "area"),
            ("compB", "C"),
        ]
    ),
)
# Create an outlier to ensure we will have a flagged value
df.loc[0, ("compA", "C")] = 3.0
df.head()
| compA | compB | |||
|---|---|---|---|---|
| area | C | area | C | |
| 0 | 1.362422 | 3.000000 | 2.363074 | -0.259567 |
| 1 | -1.169556 | 1.684685 | 0.276290 | 0.954539 |
| 2 | -0.290764 | -0.465453 | 0.001360 | -0.542507 |
| 3 | -1.534347 | 0.977421 | -1.095948 | -0.583615 |
| 4 | 0.295540 | 0.514328 | 1.137765 | -0.948378 |
Define the QA model
Many models can be found in the models .
In this example we will use the simplest model:
and we will use the simplest model: avoca.qa_class.zscore.ExtremeValues
from avoca.qa_class.zscore import ExtremeValues

model = ExtremeValues(
    # Here we define some parameters on which the model will be applied
    compounds=["compA", "compB"],
    variable="C",
    # Here are some parameters for the model itself
    threshold=2,
)
Run the QA model
In an approach similar to Machine Learning, we will first fit the model to the data and then predict the bad values.
# The model will calculate some statistics on the data
model.fit(df)

# Predict the outliers
outliers = model.assign(df)
outliers
{'compA': Index([0, 13, 47, 48, 99], dtype='int64'),
 'compB': Index([40, 56, 74, 84], dtype='int64')}
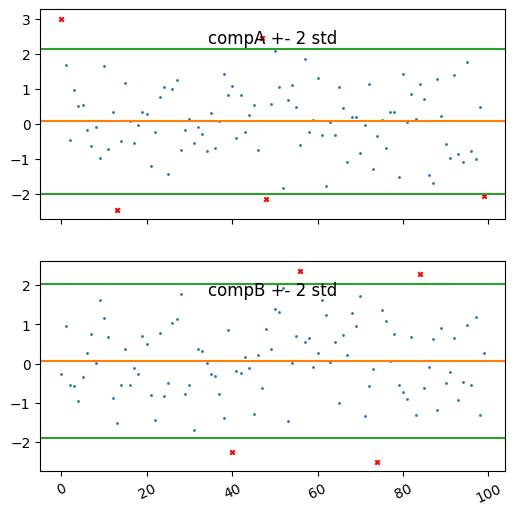
Here we can see the indexes of the bad values. But the best way to see the results is to plot the data.
For this purpose we can use the plot method of the model.
It plots the training data and the outliers.
import matplotlib.pyplot as plt
plt.style.use("default")

model.plot()
(<Figure size 600x600 with 2 Axes>,
 array([<Axes: title={'center': 'compA +- 2 std'}>,
        <Axes: title={'center': 'compB +- 2 std'}>], dtype=object))
Setting the flags
Now that we have seen how the assigner works, we would like to set the flags to the data and then be able to export it.
For this we can use the following:
from avoca.flagging import flag

df_out = flag(df, model, outliers)
df_out
| compA | compB | compA | compB | |||
|---|---|---|---|---|---|---|
| area | C | area | C | flag | flag | |
| 0 | 1.362422 | 3.000000 | 2.363074 | -0.259567 | 8 | 0 |
| 1 | -1.169556 | 1.684685 | 0.276290 | 0.954539 | 0 | 0 |
| 2 | -0.290764 | -0.465453 | 0.001360 | -0.542507 | 0 | 0 |
| 3 | -1.534347 | 0.977421 | -1.095948 | -0.583615 | 0 | 0 |
| 4 | 0.295540 | 0.514328 | 1.137765 | -0.948378 | 0 | 0 |
| ... | ... | ... | ... | ... | ... | ... |
| 95 | 0.288874 | 1.779937 | 0.239834 | 0.985665 | 0 | 0 |
| 96 | -1.140611 | -0.778068 | 0.020196 | -0.544118 | 0 | 0 |
| 97 | -0.411455 | -1.000986 | -0.685854 | 1.196296 | 0 | 0 |
| 98 | -0.415562 | 0.479010 | 0.162459 | -1.323379 | 0 | 0 |
| 99 | -0.809501 | -2.061757 | -0.540732 | 0.258029 | 8 | 0 |
100 rows × 6 columns
We can see that the value we set at the start now received a flag value, as expected.
The flag is 0 if no flag was set. Then each flag is a power of 2. Combining flags is done by adding the values together.
model.flag
<QA_Flag.EXTREME_VALUE: 8>
Export the data
Finally we would like to share this data further.
We can use the to_csv method from pandas to export the data to a csv file.
df_out.to_csv("flagged_data.csv")
However many programs will support custom flag formats.
For this avoca provides bindings to other software.
Have a look at the bindings to see if your software is supported.
Conclusions
Here we have showed on a toy example how to use @voc@ to detect bad values in a dataset.
Note that we used the same dataset for training and prediction, but in a real scenario, you could have some cleaned data that you use for training and then apply the model to a new dataset.